
Category Archives: Data Visualization
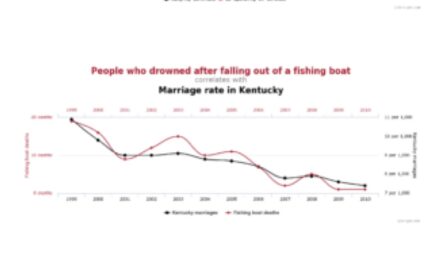
Examples of correlations that have nothing to do with causation
in this post and this one I described a couple of nice examples of correlation vs. causation cognitive biases. There are litterally hundreds out there that can be added. By doing a little search i came across a few nice […]
Occam’s razor principle
In one of my previus posts about cognitive biases I mentioned the Occam’s razor principle. When it comes to data insights this is sometimes a very useful principle to keep in mind because data does’nt give insights itself but we […]
Data Preparation
In my previous post about data visualization I have focused on different ways to present a dataset, however a very important aspect that we always underestimate and do not consider as fundamental is the data preparation one. It is widely […]
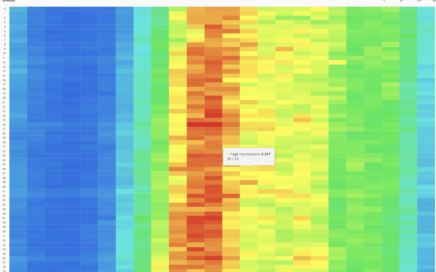
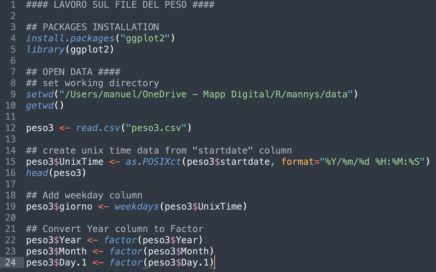
Data Visualization
A few months ago (i just realized while typing it’s almost already a year ago) i took an R course to learn how it can help with data visualization, and i have to admit it has been quite useful even […]