When making a choice for virtually anything in your life you will have to ponderate the pros and cons, especially if you are the type of person like me that likes to create lists. Usually the choice between items to purchase, or services to subscribe to, gets down to feature comparison and other evaluation criterias like the price you pay, the ease of use, how convenient it will get (or how big/small return on the investment there will be) and so on.
For example if you were to order a work or art from a painter, some of the evaluation options would be it’s price, the time it will take the artist to paint it and the quality of his work. In a perfect world scenario you, as a committer, would like it to be as cheap as possible, to be as high-quality as possible and that it won’t take ages to be compleated. Reality-check: you have to face the truth and accept that you can only get two of the three things above at the same time.
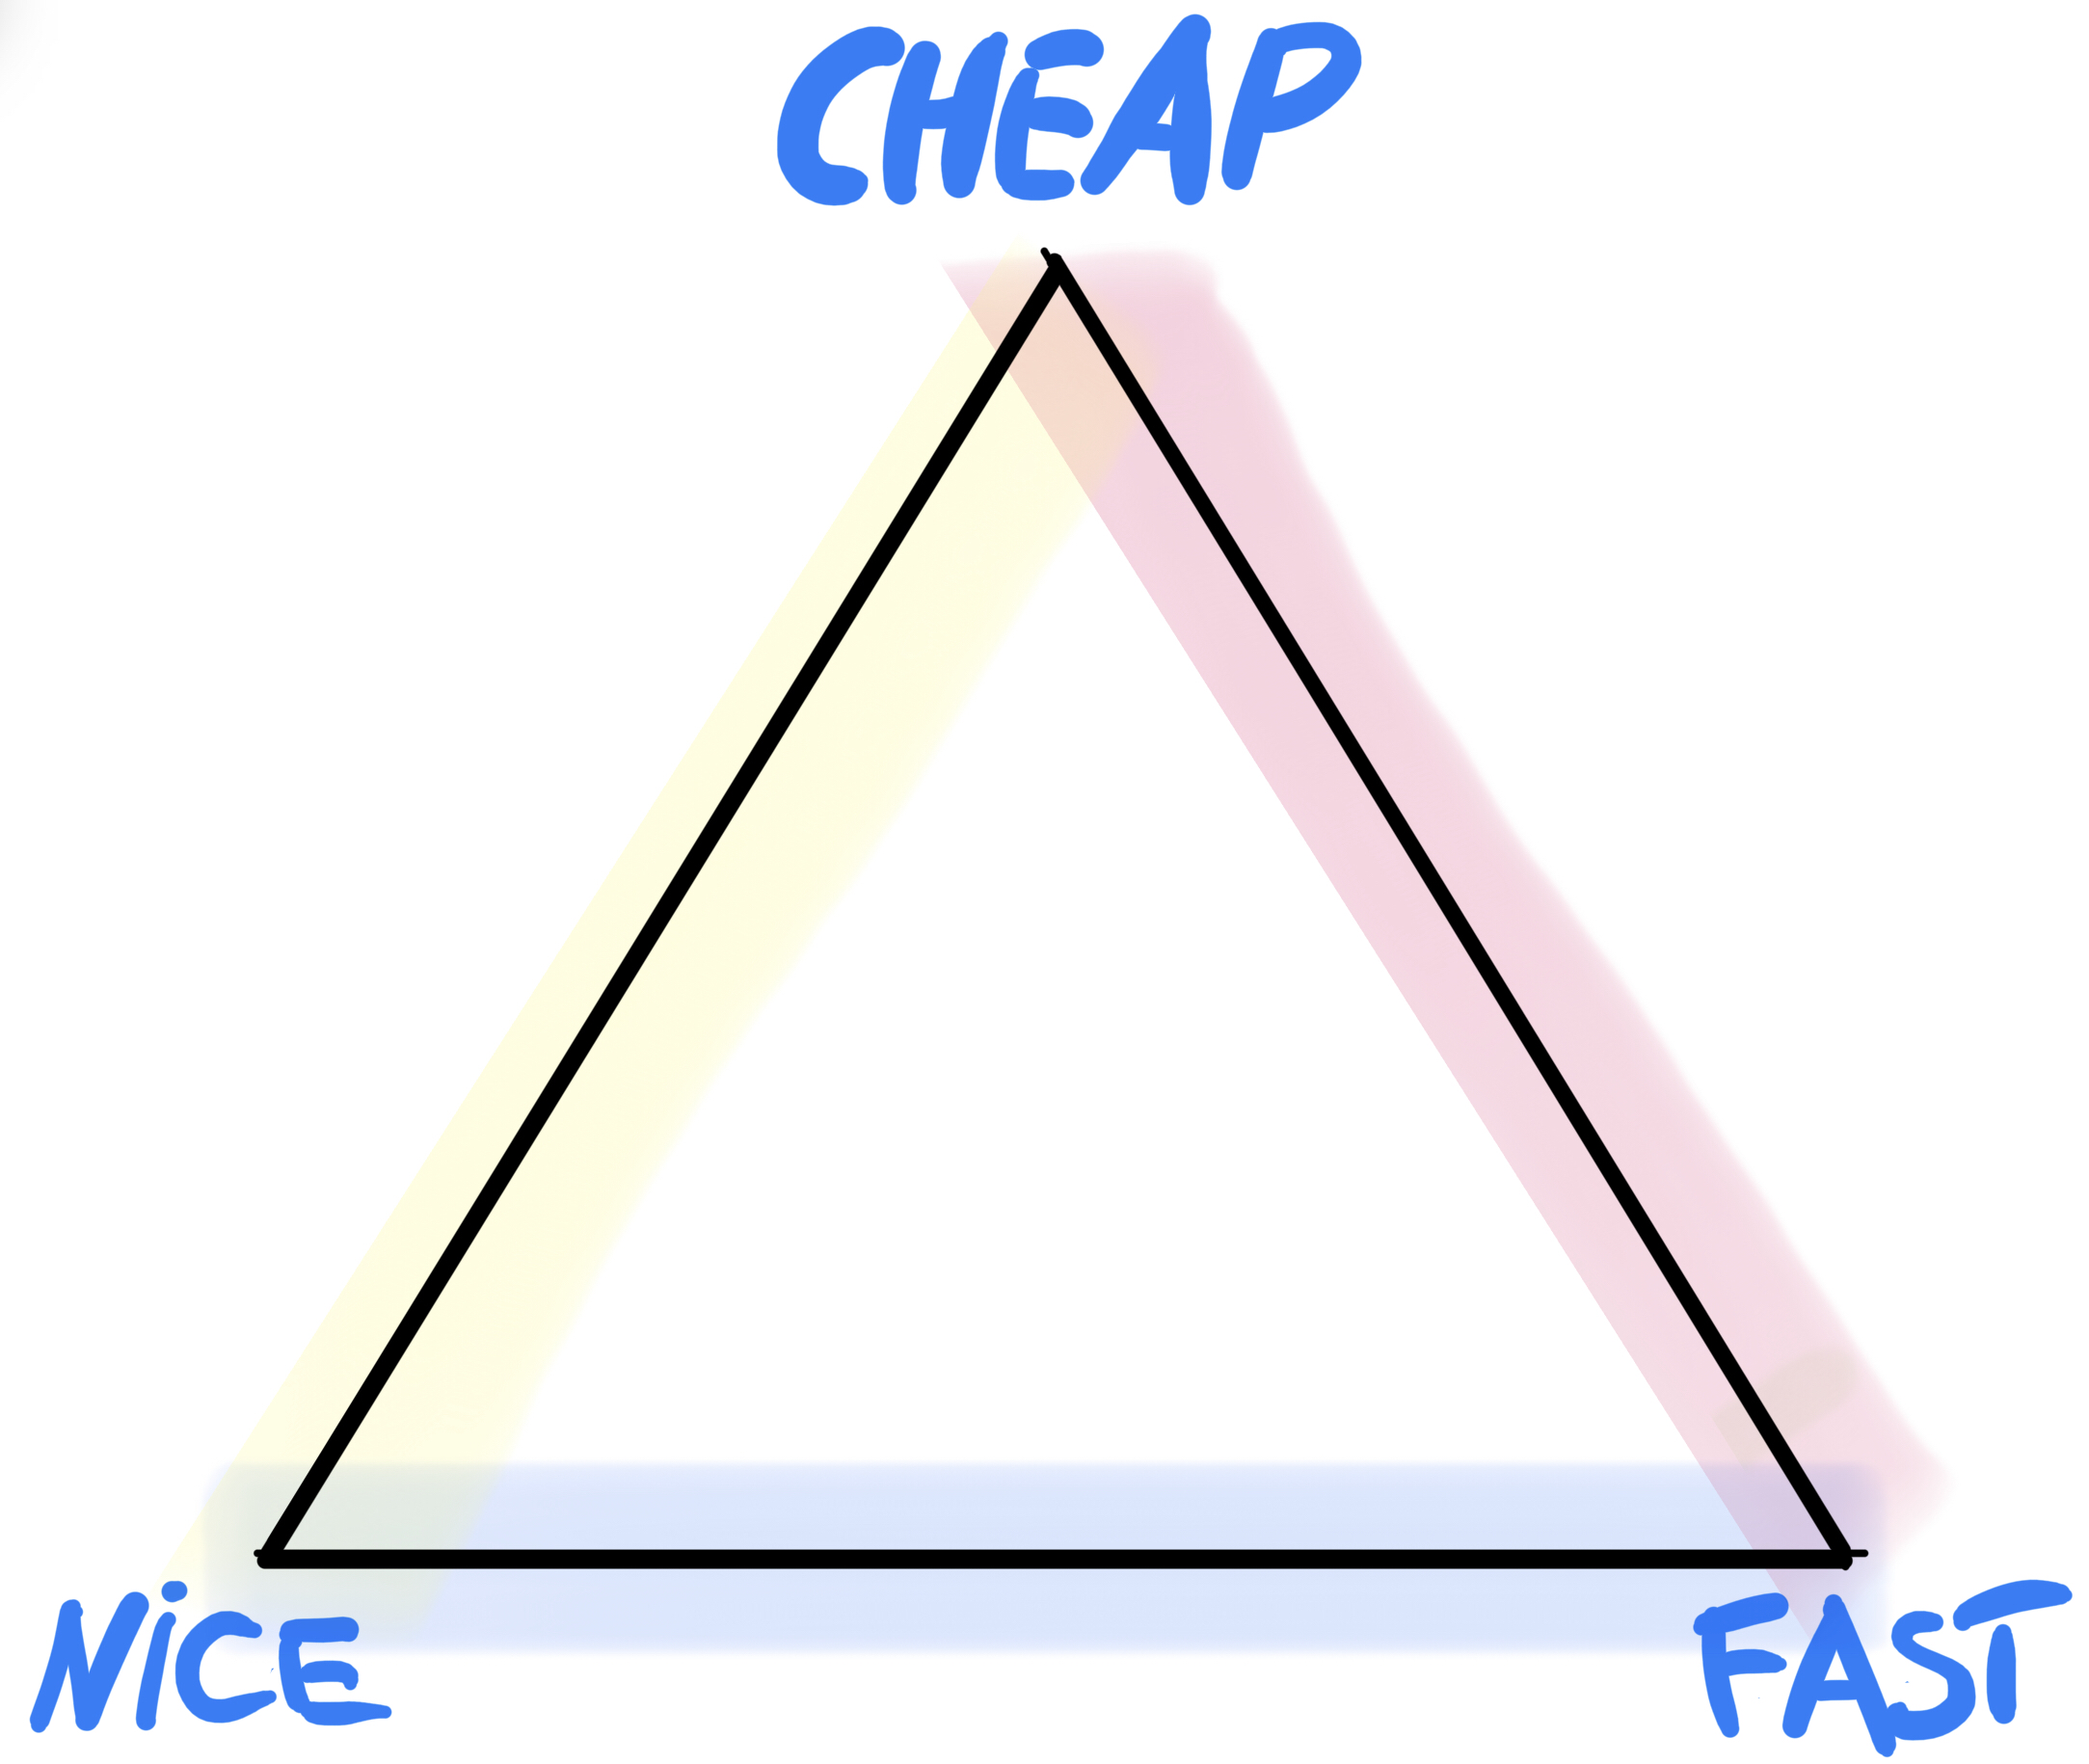
Figure this out as a triangle with the chosen characteristics on each of its vertexes. You can choose only one side of the triangle (so you will get two of its three characteristics at the same time) but you will not get the opposite one not touched by the chosen side. So in our example the painting could be NICE and FAST but it won’t be CHEAP (light blue side) it may be FAST and CHEAP but it won’t be NICE (pink side), or it will be CHEAP and NICE but it won’t be done FAST (light yellow side).
I have been testing several Analytics solutions over the years, and when it comes to some of its characteristics i can summarize the choice between the following main three:
- Ease of implementation and use.
- Flexibility of reporting and customization options.
- Cost of ownership and maintanence.
A short description of the three (you can skip this paragraph if you are familiar with this concept). Ease of implementation means how difficult it is to install (setup) and find support resources. Does implementation require coding knowledge? Does setup require some IT expertiese (this is common with OnPremise solutions) for example. Does the pixel “just works” or you need to customize the full tracking concept event by event? Does it offer templates to use? How wide is the common documentation you can find on the web? Does the vendor offer direct suport?. Ease of use is more related to the user interface itself and how easy it is to extract the needed data and run the needed analysis.
The more flexible is the user interface to create analysis and reports (and dashboards) the easier it will be to use, becasue to create your own analysis you won’t need to export anything outside of the tool for a re-work. Also the customization options of the data-model will unleash the analyst’s power to segment and cut-n-slice data in any needed way. Does the tool support custom dimensions (and how many?). Is the implementation of custom dimensions intuitive and easy? (as you can see there are crossed answers between flexibilty and ease of use).
The cost of ownership can be calculated with the cost of the service (software licence) and any hidden cost that might popup later down the line: support cost, external agency cost to maintain the service if needed, overages related to organic growth of your site’s traffic, and so on. Sometimes the cost of the licence might be zero but then there are hidden costs that should be taken into account (how much do you have to pay the external IT consultant that helped you install the OnPremise version on your wordpress server?).
So as a Digital Analytics customer you would like the chosen solution to be easy to implement and use, very customizable and with flexible datamodel and analysis builder, and it should not cost too much. Here is our Digital Analytics Solution impossible triangle then:
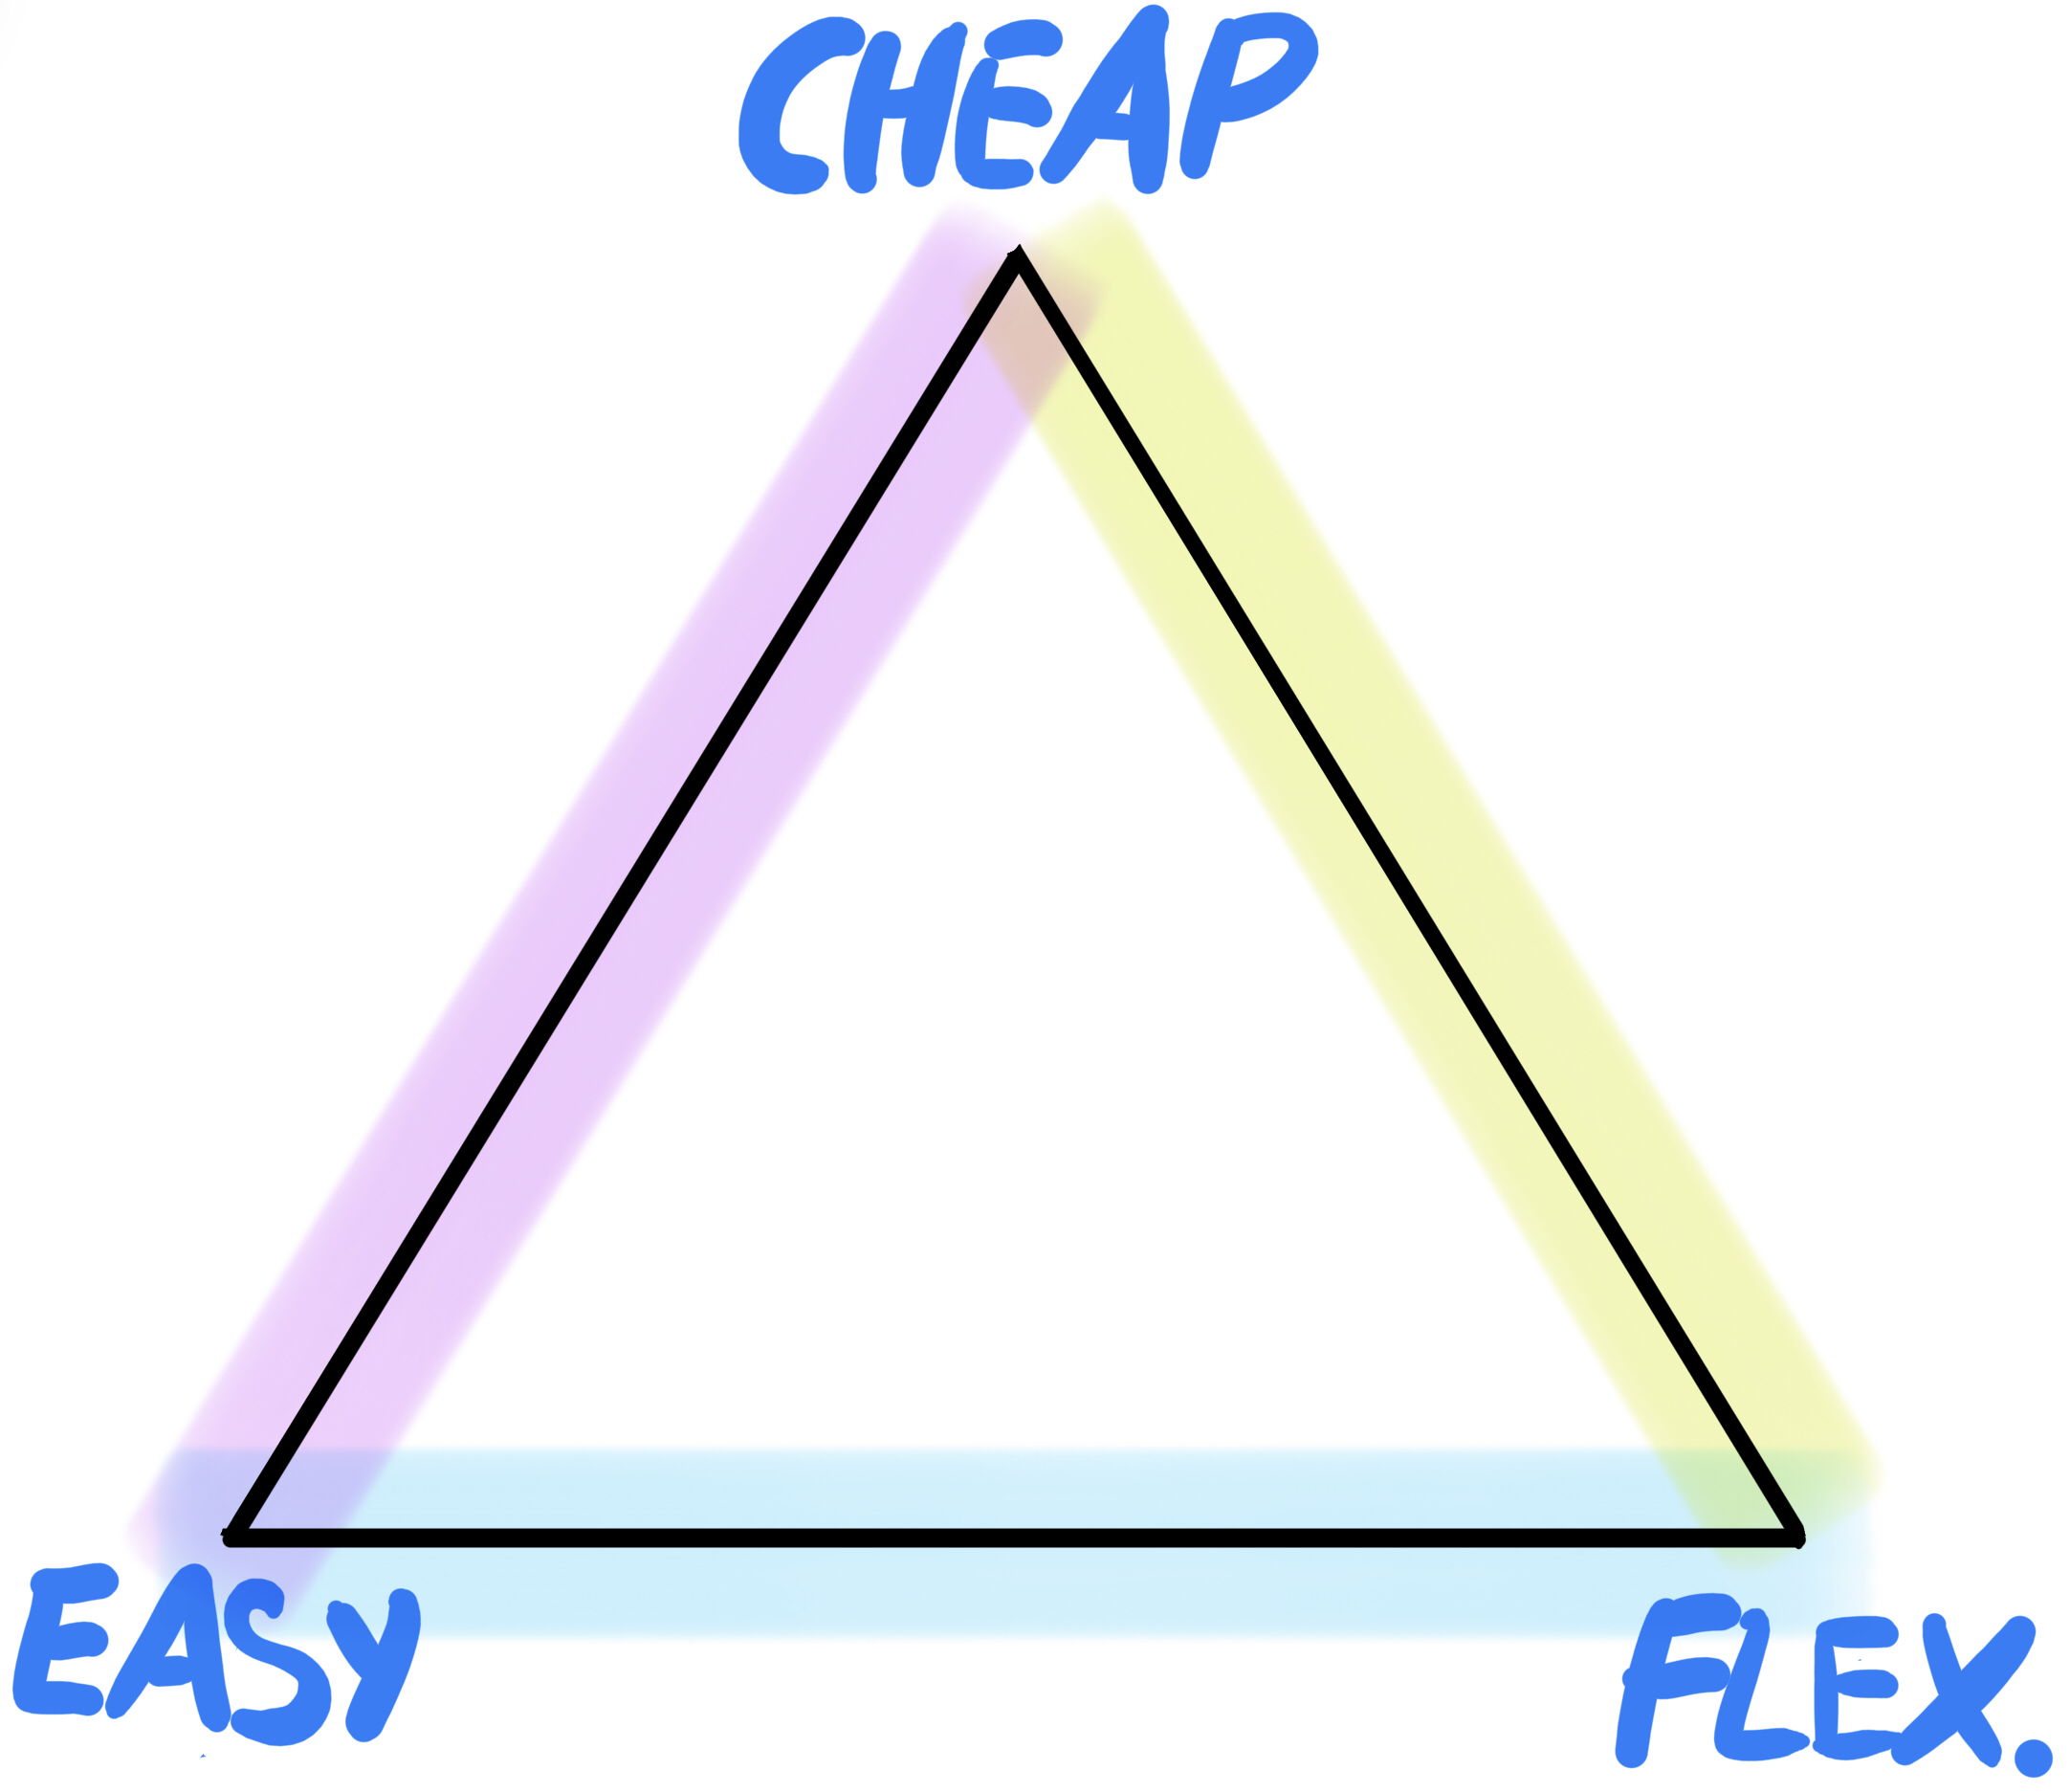
Let’s read it together: it may be cheap and easy but it won’t be flexible (purple side), it may be easy and flexible but it won’t be cheap (light blue side), or it may be cheap and flexible but it won’t be easy (lime-green side). Let me try to give an example for each of the 3 types now.
On the light-blue side we find the majority of premium/enterprise Digital Analytics solutions. Adobe Analytics, Mapp Intelligence, Piano Analytics, Piwik Pro, Shinystat Pro and so on. Of course each software as a service Digital Analytics Platform has its own pros and cons, some of those may be more expensive then the others or more flexible then the others, but the overall idea here is to find common characteristics, so all of those have in common that all tend to be easy and flexible but not cheap.
On the lime-green side there are the CHEAP and FLEXIBLE ones. We can find software like Matomo On Premise, Google Analytics 4, and generally speaking any Web Analytics platform that requires A LOT of effort to be implemented and maintened as well as a lot of experience to be used at it’s best. For example Matomo OnPremise is somewhat more flexible then the Cloud version (and it’s fee to install). However the more flexibility you need the more expensive it gets to be maintained, since you need to purchase additional modules (still on the cheap side, up to 500€ per year for enabling all the modules). However the biggest hidden cost here will be maintanence: you need to host the system on your own server, therefore you need to own a MySql Database, which comes at a cost based on its size, so the more traffic your site has, the higher will be the price to scale-up. For this reason this type of solution is ideal for small sized websites to keep the cost of ownership down. But why isn’t it easy to use? it’s more about the implementation (setup) and maintanence that requires IT knowledge. Why is it flexible? maybe you won’t be able to run any type of desired analysis using the Matomo UI, but since the data sits in your own MySQL database you can in theory connect it to any 3rd party data visualization tool (e.g. Google Data Studio) to run your query and reports in any custom way. Again, also this part requires some level of IT knowledge, so it is not easy. A couple of words about Google Analytics 4 and the reason why it falls now into this category: implementation wise is as easy as it could get with the support of well-establieshed GTM support and common knowledge, however the new data-model and the approach to the data exploration makes it a tool that is more intended for data-scientist and data-analysts then a marketing tool to run daily reports. Don’t get me wrong: it is very powerful when it comes to customizing the analysis, but it’s not for everyone as GA Universal used to be. So in my opinion GA4 now sits on the Flexible/Cheap side of the impossible triangle.
Then there is the purple side, with the EASY and CHEAP ones, usually referred to as “stat counters” (we have a very known example here in Italy, called Shinystat, that used to be the counter of choice by many since 20 years ago). There is a huge amount of free counters that offer more or less features but all of them have in common the fact that while being easy to use and cheap (if not even free), none of them has any feature that i would refer to as being “flexible..”. You will only get what they offer, nothing more and nothing less. Under this category i would position Yandex Metrica, Plausible, Simple Analytics, Baidu Analytics, StatCounter, the previously quoted Shinystat Free, and so on.