How to create your own KPI and live happily ever after.

When trying to derive insights from a dataset and defining KPI the causality bias is a common error. Often it goes together with another common error: attributing an insight to the wrong KPI, or better said: deriving the wrong insight from a KPI. Sometimes we are being told that a KPI is bad when it’s value is high (bounce rate) or it’s good when its value is high (conversion rate). But sometimes the context is much more important then the value itself.
The same KPI tells different stories depending on its context. For example a page can have an high bounce rate and still be engaging. Let’s look at a bounce rate KPI from a publisher’s perspective and look at our own experience in our day to day browsing: how often do you browse social media and come across an interesting article title, click it, read the article and then go back to the social where you came from? For the publisher that is a bounce visit… but if you read the article you somehow reached your goal to inform yourself on that article’s content, so you were engaged with the content. It is a sort of soft-conversion (applying my definition of conversion: the point of contact between the demand and the offer).
So is a bounce visit a bad visit or a good one? Of course it depends on the context (and the goal). In this case bounce rate should be analyzed coupled with an engagement rate to get a complete picture of the user engagement.
Of course the ultimate goal for a publisher is to convert a non-subscriber user to a subscribed customer (or sell a single article if behind a paywall). But once subscribed the user should be engaged with the content, otherwise they will likely not renew their subscription once it expires.
So, how can we define a KPI to keep track of the content engagement?
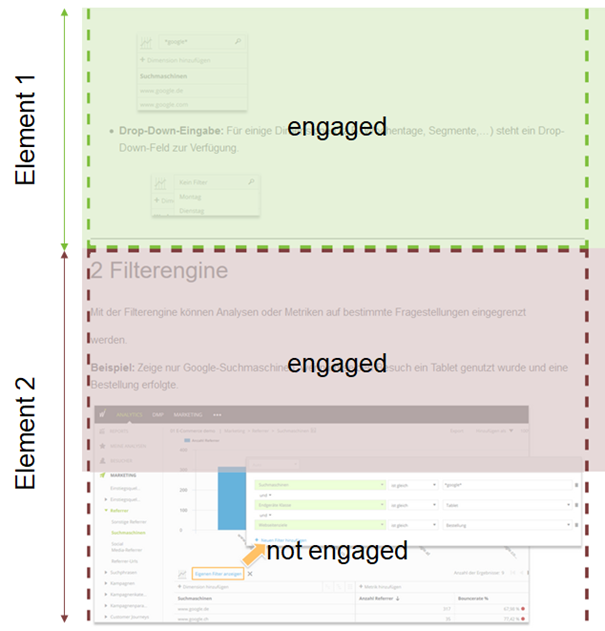
When we read a content we focus our attention to certain screen real-estate. We ignore advertising, and therefore we scroll to the content. So we should define in a page what is content and what it is not. Usually a page is programmed with different DIV so that the content is “emboxed” in a certain DIV and it’s identifiable.

So, once we identify the “readable content” in a page, how do we track engagement with it?
We could track page scroll, however as already mentioned, full page scroll is not enough to assess content engagement, neither would be to contextualize scroll to the content area of the page, because when it comes to engagment also time spent reading matters.
Ideally we need to combine factors: time, scroll and more specifically the amount (percentage?) of content that is visible in the browser screen.
<ADVERTISING>
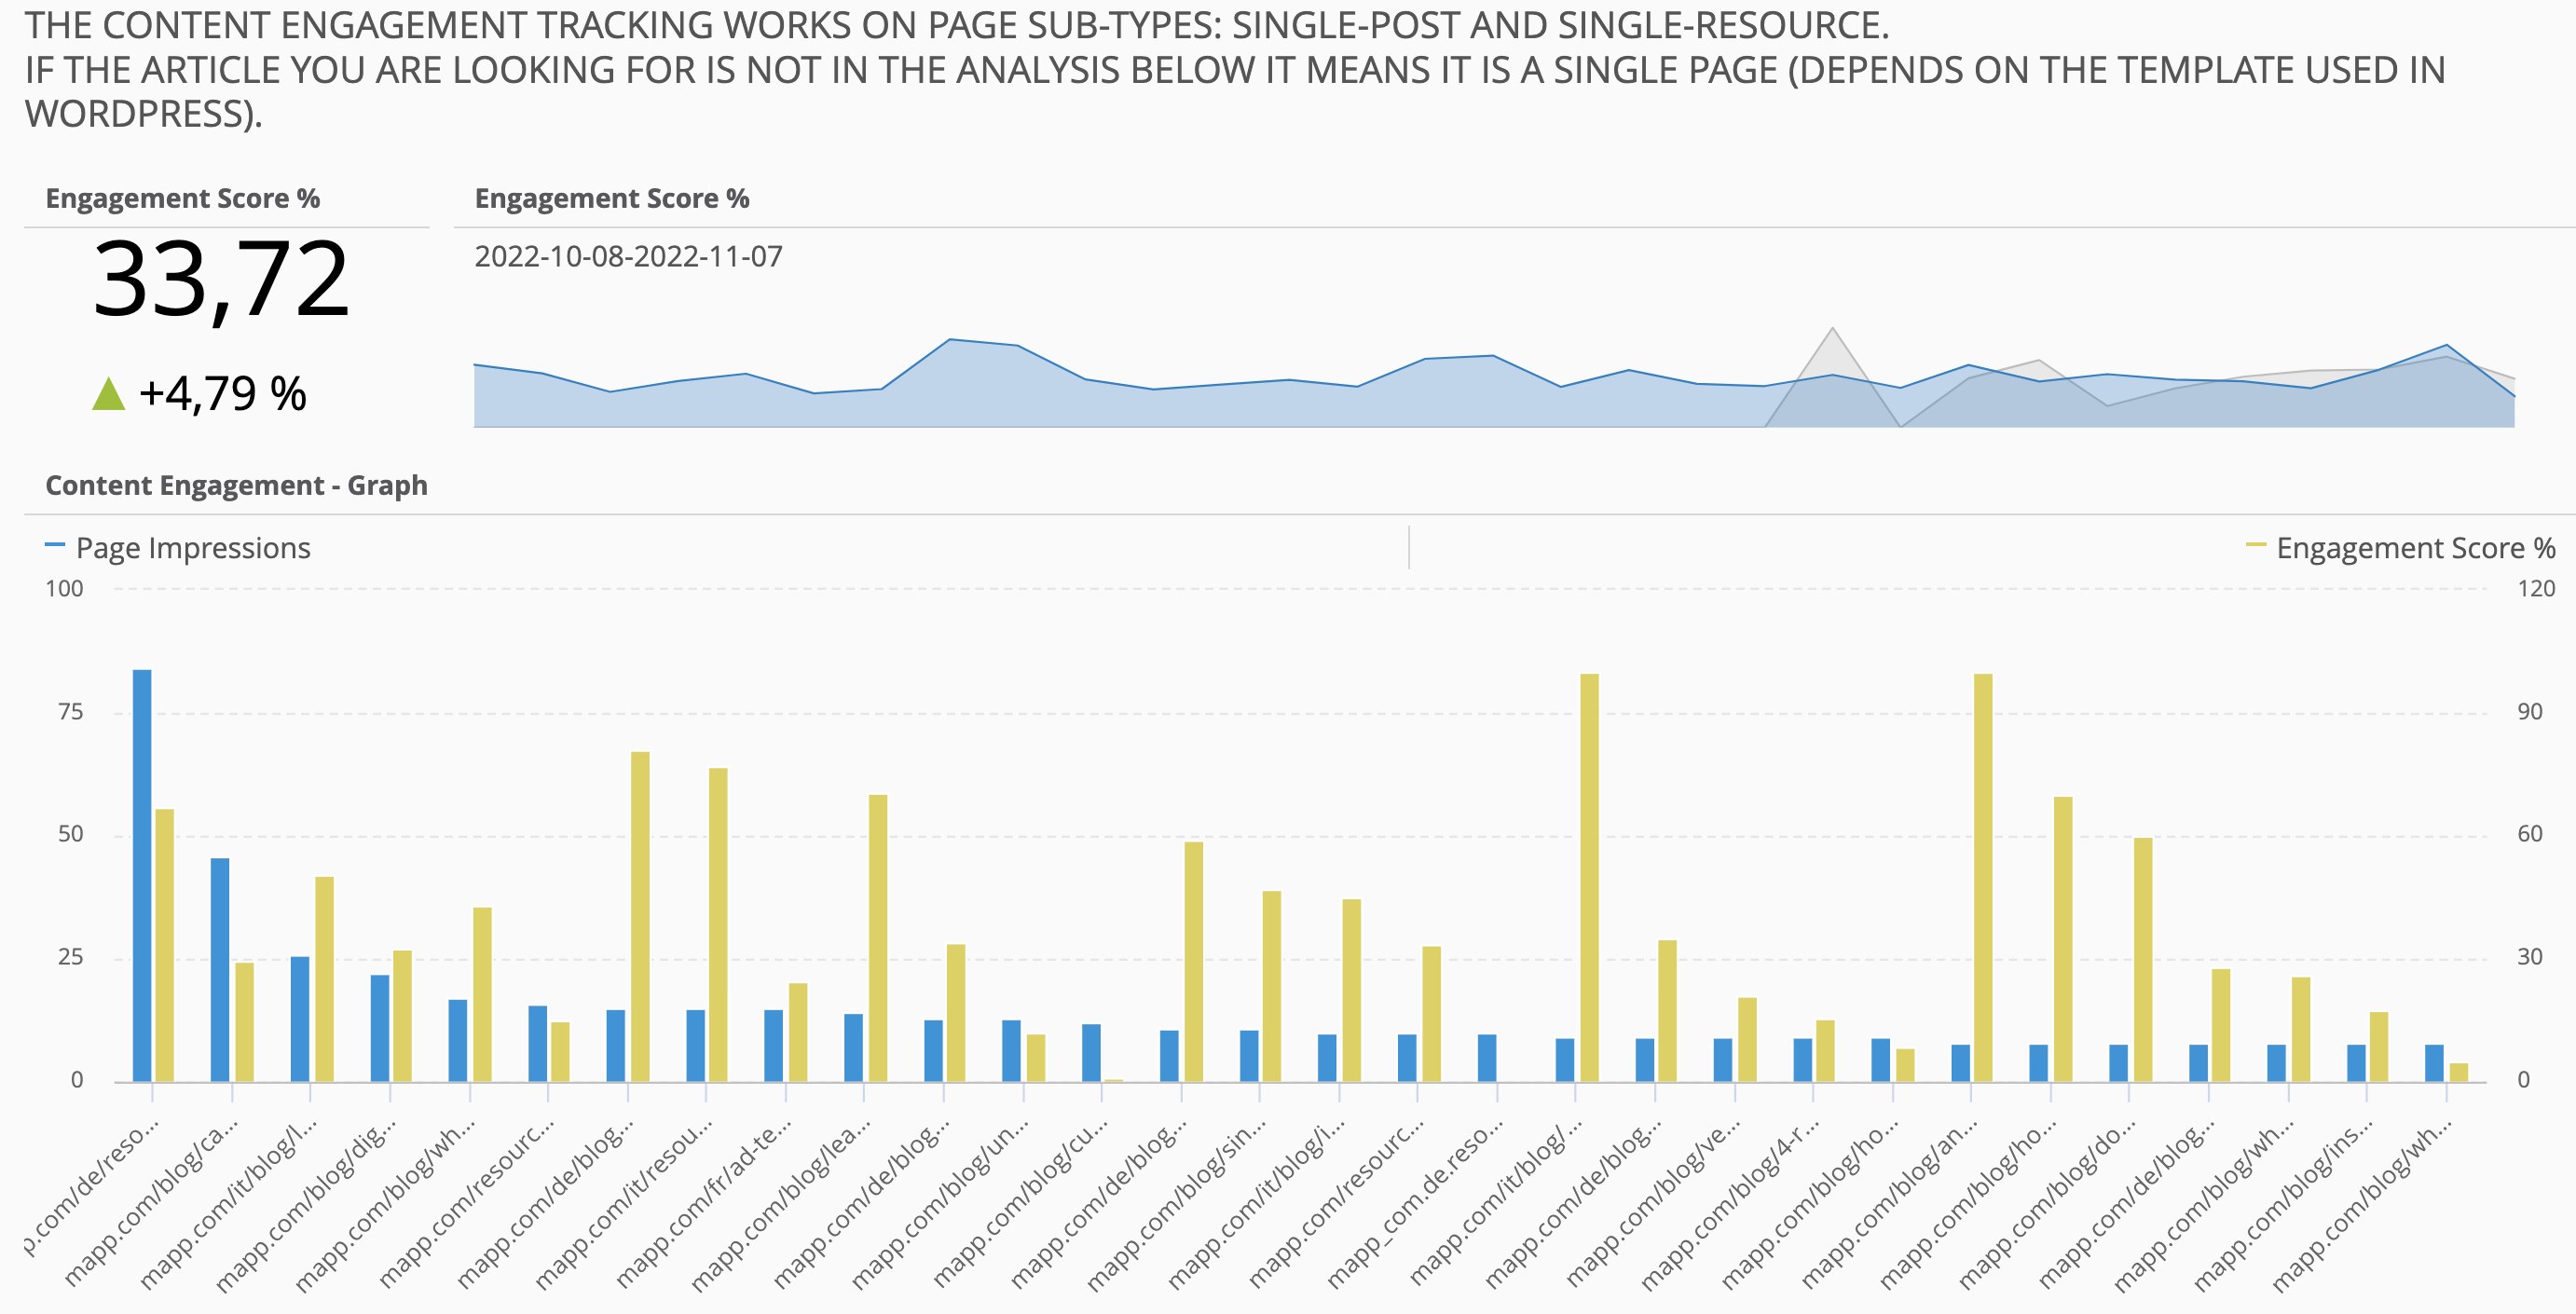
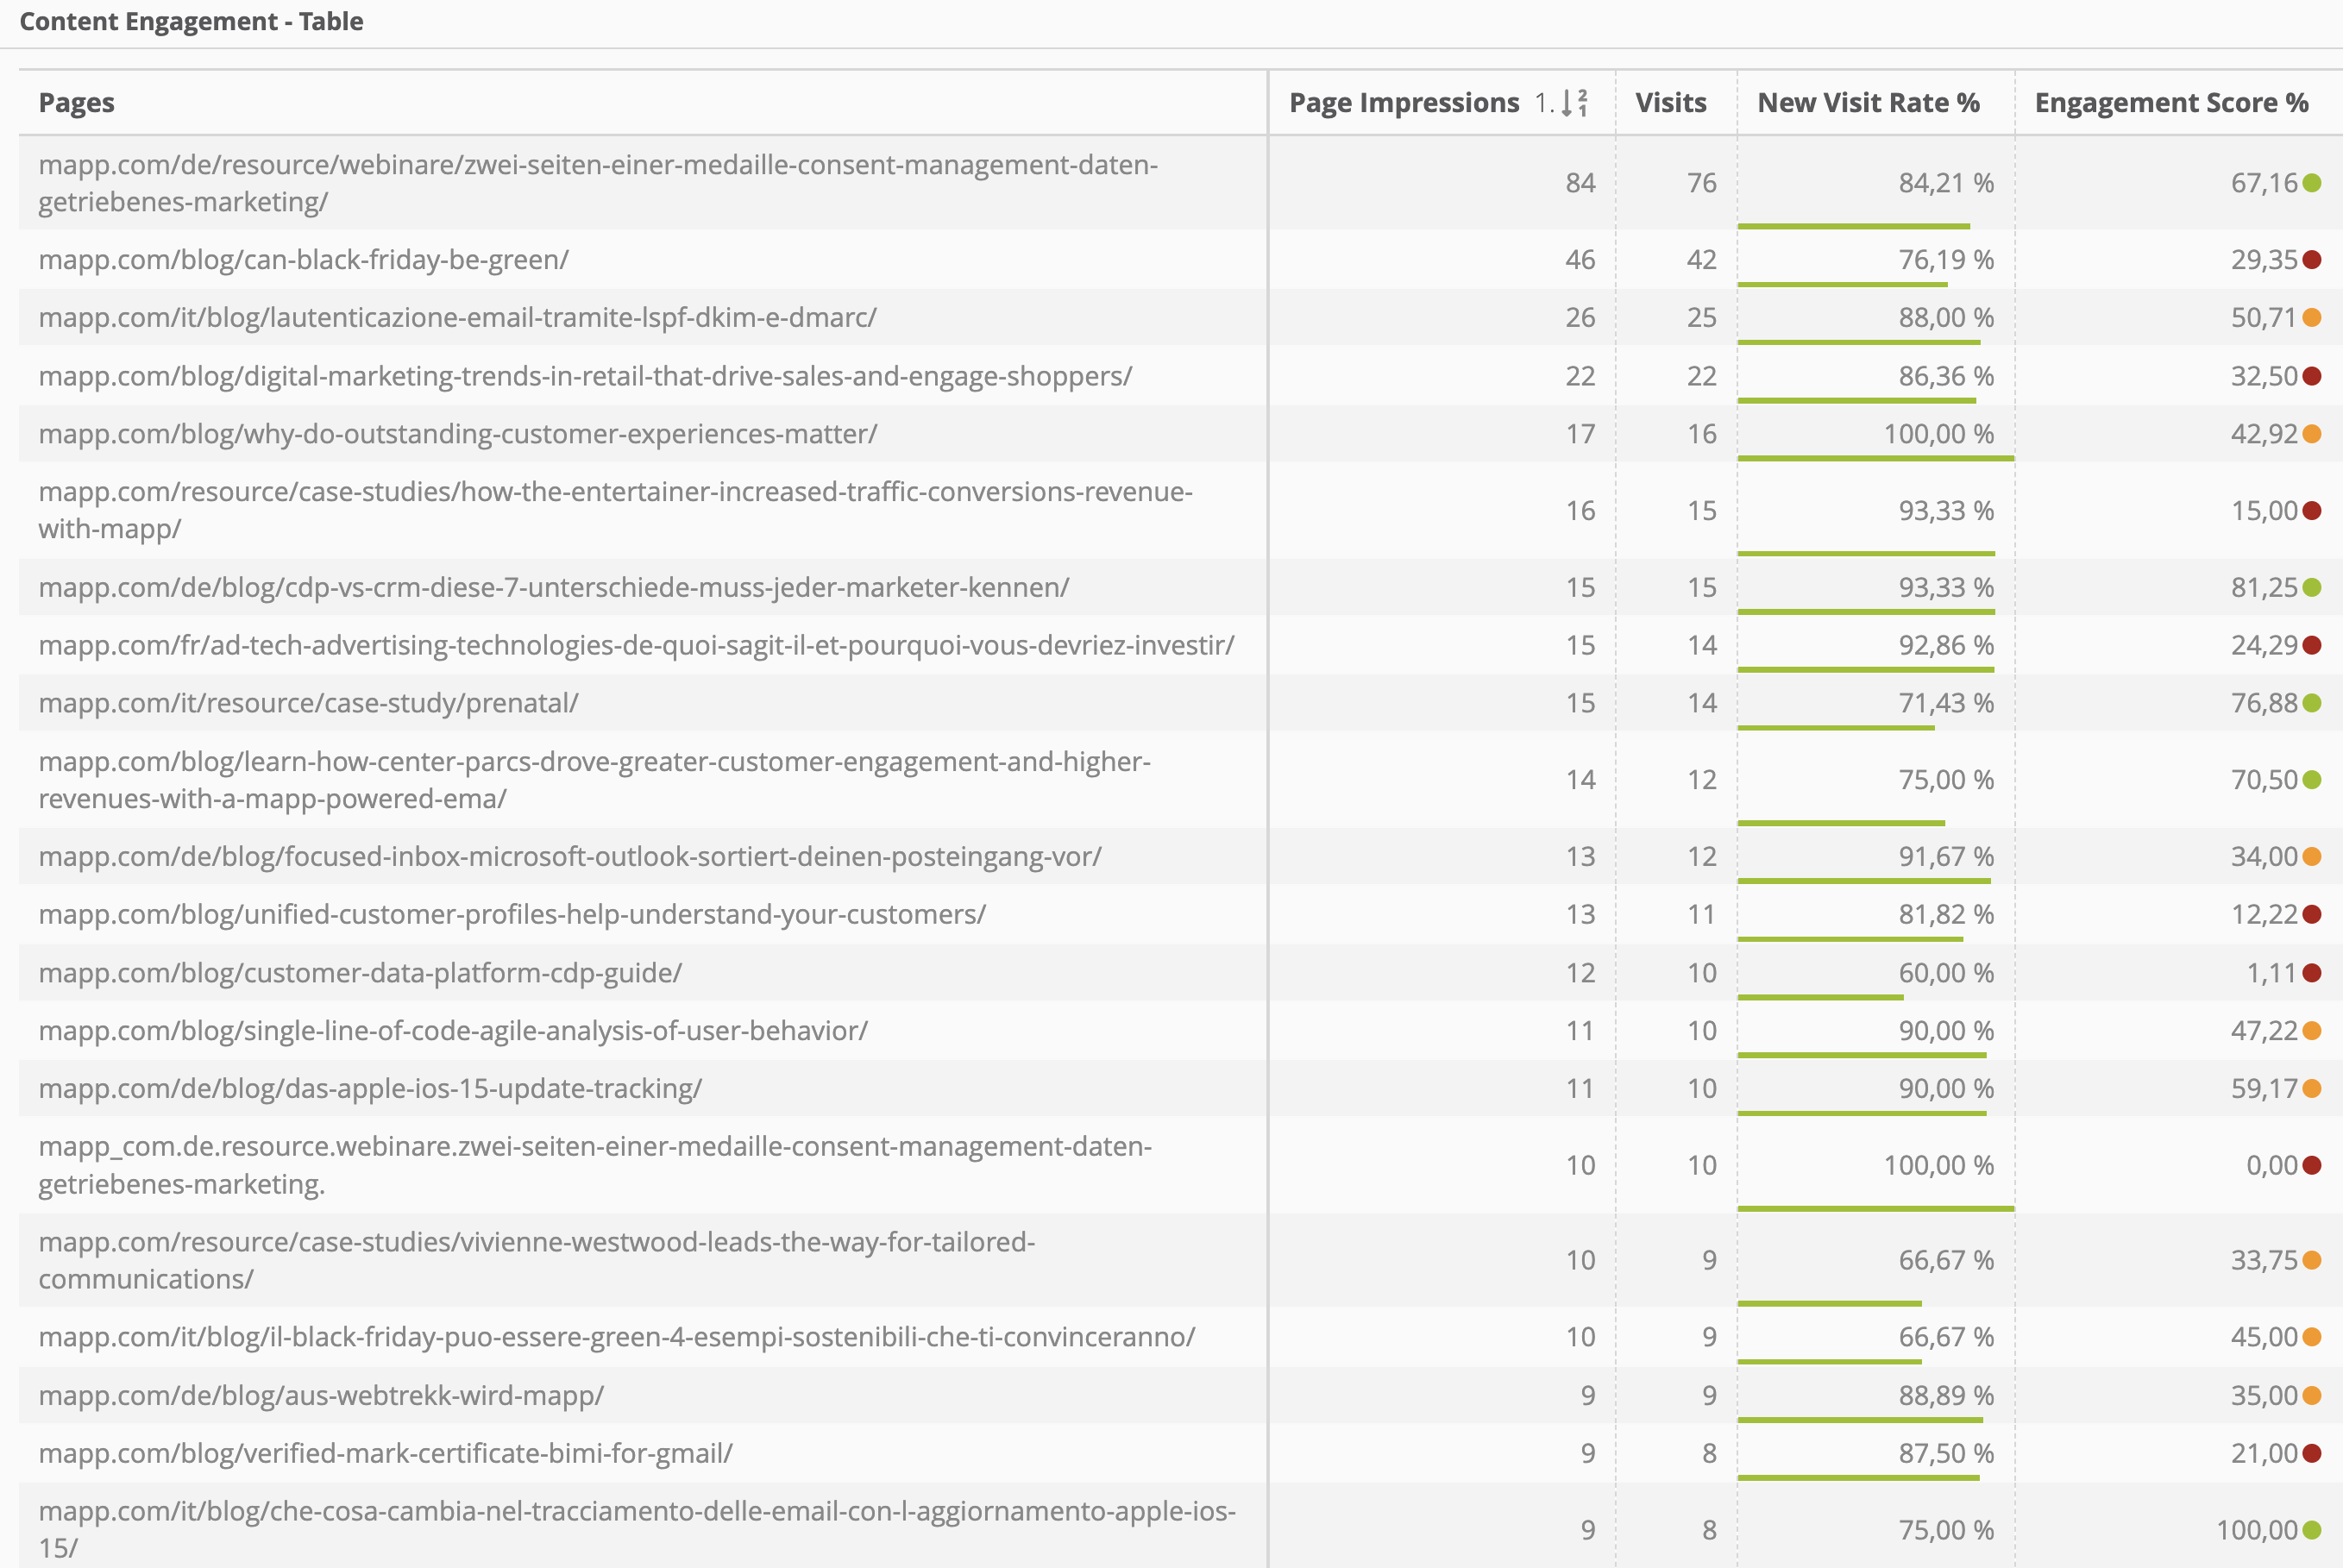
Content Engagement Plugin – a Mapp Intelligence tracking add-on – does exactly this. It allows to define the “content real-estate” of a page, and tracks the amount of seconds the content is viewable in the user’s browser, and depending on the combination of time and percentage of the article viewed, it automatically assigns an engagement score to each content viewed.
If you want to learn more about the Content Engagement plugin, here is the link to the official documentation.
</ADVERTISING>