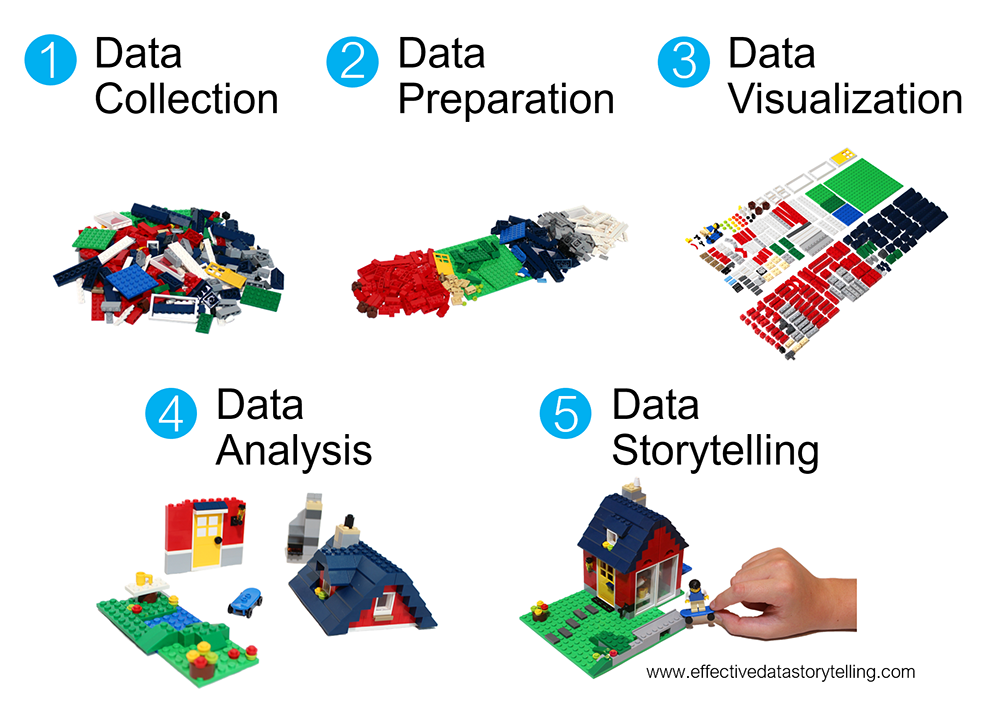
In today’s data-driven world, we often hear terms like data and insights used interchangeably. However, there is a fundamental difference between these two concepts. In simple terms, data refers to raw facts and figures, while insights are meaningful interpretations and conclusions derived from data. I recently came across this article using a Lego analogy to explain the different phases needed to derive a storytelling from data collection:
So i started wondering how to summarize the difference between data and insights. Let’s start from defining each one.
What is Data?
Data is any information that can be collected and analyzed. Some data may also not be analyzed, so usually we might need to do some data preparation (in fact data preparation is the most time-consuming activity among the data analytics tasks).
What is a Dataset?
A dataset is a set of data that belongs to a particular topic or phenomenon. We must realize that we can collect a huge amount of data, but what we need to keep in mind is the context we need the data for. Not all the collectable data is useful and appropriate for our purpose. We need to avoid to have a data-tsunami, flooding our data wharehouse with useless data.
Data can be in the form of numbers, text, images, audio, or video. Data can be structured or unstructured, depending on how it is organized.
- Structured data refers to information that is organized in a specific format, such as a spreadsheet, database, or table.
- Unstructured data refers to information that is not organized in a particular format, such as emails, social media posts, videos, and so on.
In my Digital Analytics experience we tend to work much more with structured data, and i feel lucky about this because unstructured data is way more complex to be analyzed (think of a search for a specific semantic meaning through a blog post, being able to distinguish irony and jokes among comments about a specific brand). Sentiment analysis is probably the most difficult insight extrapolation i can think of.
Data can be further classified into quantitative and qualitative data.
- Quantitative data refers to numerical data that can be measured and analyzed statistically. Examples of quantitative data include sales figures, website traffic, and customer satisfaction scores.
- Qualitative data, on the other hand, refers to non-numerical data that is subjective and cannot be measured statistically. Examples of qualitative data include customer feedback, product reviews, and social media comments.
In Digital Analytics we tend to use more quantitative data rather then qualitative data, however qualitative data can be further summarized with well-thought KPIs that translate qualitative data into quantitative data.
What are Insights?
Insights refer to the meaningful interpretations and conclusions drawn from data. They are the result of analyzing and interpreting data to extract valuable information that can be used to make informed decisions (also referred to Data Driven insights). Insights are often used to identify trends, patterns, and relationships that exist within the data. They can also be used to identify problems and opportunities.
Insights can be categorized into three main types: descriptive, predictive, and prescriptive.
- Descriptive insights describe what has happened in the past and provide a historical perspective on a particular topic or phenomenon.
- Predictive insights use data to make predictions about future trends and events.
- Prescriptive insights provide recommendations on what actions to take based on the insights gained from the data.
The Difference between Data and Insights
The main difference between data and insights is that data refers to raw facts and figures, while insights are meaningful interpretations and conclusions drawn from data. Data is often vast and unstructured, making it difficult to derive any meaningful information from it. Insights, on the other hand, are the result of analyzing and interpreting data to extract valuable information that can be used to make informed decisions.
Data is often used to provide a baseline of information, while insights are used to provide a deeper understanding of a particular topic or phenomenon. For example, a company might collect data on customer satisfaction scores, but it is only through analyzing and interpreting the data that insights can be gained about what is driving customer satisfaction and what areas need improvement.
Data is objective, while insights are subjective. Data is often collected without any preconceived notions or biases, while insights are influenced by the person interpreting the data. This is why it is essential to have a diverse team of analysts with different perspectives and experiences to analyze data and draw meaningful insights. It is very important to become aware of our own cognitive biases when we approach insights driven decisions, because our own biases play a very important role when we derive insights from data. Here is a post talking about the Survivorship Bias:
The Role of Data and Insights in Decision-making process
Data provides a foundation of information that can be used to make informed decisions, while insights provide a deeper understanding of the information to help guide decision-making.
In today’s data-driven world, businesses and organizations must collect and analyze vast amounts of data to gain a competitive advantage. However, collecting data alone is not enough. It is essential to analyze and interpret the data to gain valuable insights that can be used to make informed decisions. This is why data analysts and data scientists are in high demand in many industries.
If we derive insights from wrong data, it is very likely that our insights will be also wrong. So it’s very important (fundamental) that the data we analyze is accurate and complete (or at least statistically meaningful).